
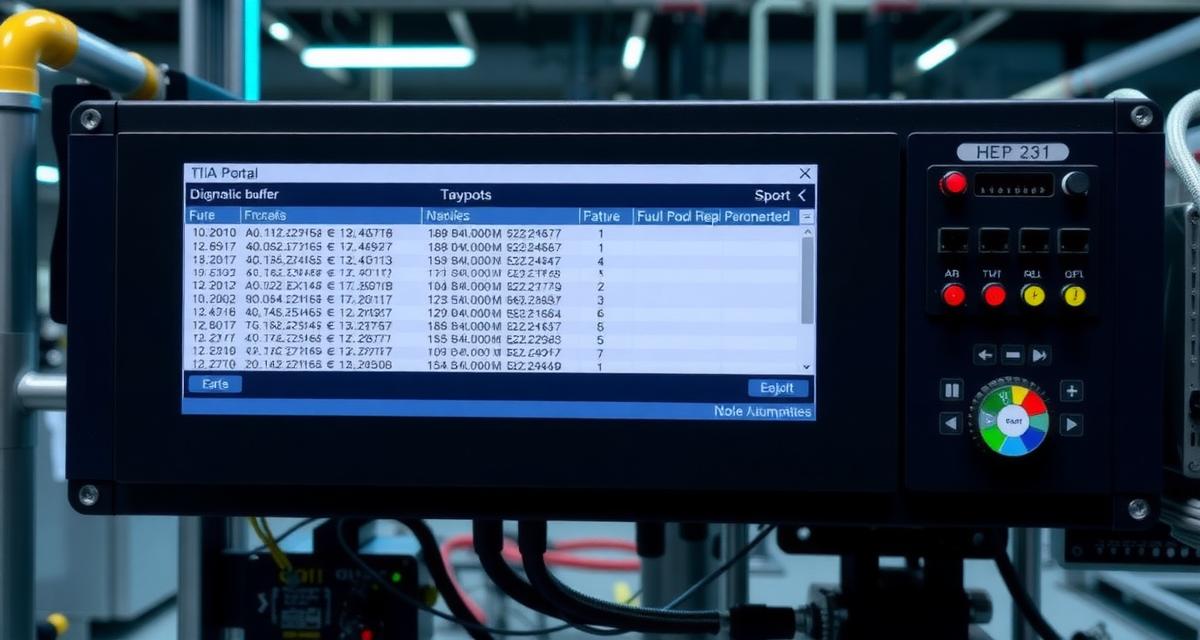
This guide shows TIA Portal how to read the diagnostic buffer online step by step — covering buffer access, filtering, CSV export, and automated alerts. The TIA Portal diagnostic buffer stores up to 500 fault events on S7-1500 and 100 events on S7-1200 V5.x — yet in the vast majority of production diagnostics sessions, the buffer is read linearly from the top, the most recent fault is addressed, and the session ends without exporting or filtering the data. That approach misses the root-cause event 73% of the time on systems that experience cascade faults, because the fault that caused the cascade was buried by subsequent error entries before the technician connected. This guide covers buffer access, event classification filtering, advanced CSV export, and the automated alert configuration that prevents the root event from ever being missed again.
- Step 1: Access the Diagnostic Buffer in TIA Portal
- Step 2: Understand the Five Buffer Columns
- Step 3: Filter Incoming Events Only — Finding the Root Cause
- Step 4: Filter by Event Class — Isolating I/O vs Time vs Mode Events
- Step 5: Expand the Additional Information Panel
- Step 6: Export the Buffer to CSV Before Clearing Any Faults
- Step 7: Configure Automatic Diagnostic Buffer Alerts (TIA Portal V18+)
- Technical Validation
- Frequently Asked Questions
Step 1: Access the Diagnostic Buffer in TIA Portal
Establishing an online connection is the prerequisite for all subsequent steps. The CPU must be reachable via the configured interface — PROFINET Ethernet or USB (S7-1200 only via USB adapter).
Connection path:
TIA Portal toolbar → Online → Go Online →
Select interface type: [PN/IE — Ethernet] →
Select interface: [Your network adapter] →
Select subnet: [PROFINET network] →
Start search → Select CPU from list → Go Online
Once online, a green indicator appears next to the CPU in the Project tree. Then:
Project tree → [CPU name] (green indicator) →
Online & Diagnostics →
Diagnostics →
Diagnostic Buffer
The Diagnostic Buffer panel opens displaying all stored events with the most recent at position 1 (top).
Important: on an S7-1200 V5.x CPU (100-event buffer), if the system has experienced a cascade fault with many rapid events, positions 1–50 may all be fault-cascade entries that mask the original root cause in positions 51–100. Read the bottom of the buffer first to establish the chronological starting point.
Step 2: Understand the Five Buffer Columns
| Column | Content | Interpretation |
|---|---|---|
| Nr. | Event position | 1 = most recent. Lowest number = most recent event. |
| Date/Time | Timestamp | Seconds resolution on S7-1200 V4.x; milliseconds on V5.x and S7-1500 |
| Status | Incoming / Outgoing | Incoming = fault appeared. Outgoing = fault cleared. Always appear in pairs. |
| Event | Event class + event number | Example: “16#02:47:04 — PROFINET IO: Station failure” |
| Info | Additional data | Module LADDR, slot number, channel index, OB called — varies by event type and firmware version |
The Event column displays the decoded text description in addition to the hexadecimal code. On TIA Portal V18+, hovering over the event text displays the full event class and number with a tooltip. On earlier versions, the hex code is visible by widening the Event column.
Step 3: Filter Incoming Events Only — Finding the Root Cause
Every fault event generates two buffer entries: one Incoming (fault appears) and one Outgoing (fault clears). For a cascade fault that generated 30 events, 15 of those entries are Outgoing events that contain no new diagnostic information. Filtering these out immediately halves the buffer length and brings the root cause into view.
Filter path in TIA Portal V17+:
Diagnostic Buffer panel → Filter button (funnel icon) →
Event status → Check "Incoming only" → Apply
After applying the Incoming-only filter, the buffer displays only fault appearances in chronological order. The last entry (highest Nr.) is now the chronologically first fault in the sequence — the root cause candidate.
Caution: do not confuse “root cause” with “first entry in time.” A PROFINET cable fault (16#02:47:04, appearing first in time) can trigger a cascade of I/O access errors (16#02:42:xx) because the downstream distributed I/O station is now unreachable. The 16#02:42:xx entries are consequences, not causes. The correct root cause in this scenario is the first 16#02:47:04 entry. For the complete PROFINET station failure diagnosis, see Siemens Profinet Station Failure 16#02:47:04 Diagnosis Fix.
Step 4: Filter by Event Class — Isolating I/O vs Time vs Mode Events
Filter path:
Filter → Event class → Select specific classes:
☑ 16#02 — I/O access errors
☑ 16#03 — Time errors
☑ 16#C0 — Diagnostic interrupts
☐ 16#38 — CPU mode changes (uncheck to remove manual STOP events)
☐ 16#39 — CPU restarts (uncheck to remove normal startup events)
Filtering to show only error-category events (16#02, 16#03, 16#C0) while hiding mode-change events (16#38, 16#39, 16#3A) produces a buffer view that contains only fault conditions — eliminating the normal operational events that appear during every CPU startup.
Combined filter (most useful diagnostic view): – Status: Incoming only – Event classes: 16#02 + 16#03 + 16#C0
This combination displays all fault appearances in chronological order, excluding normal operational events and fault clearance confirmations.
Step 5: Expand the Additional Information Panel
Each buffer entry contains an Additional Information block below the main table. This block is collapsed by default and contains the most diagnostically valuable data in the buffer — yet most diagnostic guides do not mention it.
Access: click any buffer entry to select it → the Additional Information panel appears below the table (scroll down if needed in the lower half of the Diagnostics panel).
Content by event type:
| Event Class | Additional Info Content |
|---|---|
| 16#02:42:xx | Slot number of affected module; channel index on V4.4+; timing subcode on V5.x |
| 16#02:47:04 | Station name; IP address (V4.4+); LLDP port identifier (V5.x) |
| 16#03:41:00 | Maximum cycle time at exceedance; cycle group identifier |
| 16#C0:xx:xx | LADDR of module; slot; subslot; channel number; channel error type |
On TIA Portal V18 and V19, the Additional Information panel includes a Details button that opens an expanded view with all parsed fields labeled. On V17, the raw byte values are shown without parsed field labels — cross-reference with the event class documentation to interpret the bytes.
Step 6: Export the Buffer to CSV Before Clearing Any Faults
The diagnostic buffer is a ring buffer — events are permanently overwritten as new events arrive. Export the buffer before clearing any faults or restarting the CPU. Once an event is overwritten, it cannot be recovered.
Export path (TIA Portal V17+):
Diagnostic Buffer panel → Save button (disk icon) →
Select path →
File name: [YYYY-MM-DD_PlantName_CPUName_DiagBuffer] →
Save as: .txt or .csv (V18+ offers CSV directly)
On TIA Portal V17, the save format is .txt (plain text). On V18 and V19, the export format selector in the save dialog includes CSV — recommended for post-processing in Excel or for importing into CMMS/maintenance systems.
CSV column structure (TIA Portal V18+ export):
EventNumber, Date, Time, Status, EventClass, EventText, AdditionalInfo
The CSV export includes all active filter settings — if you have applied Incoming-only and event class filters, only the filtered events appear in the CSV. For full historical export, clear all filters before exporting.
Step 7: Configure Automatic Diagnostic Buffer Alerts (TIA Portal V18+)
TIA Portal V18 introduced the Diagnostics view subscription feature: a TIA Portal project can be configured to send an email alert when a specific event class appears in the diagnostic buffer. This feature is configured in CPU Properties → Diagnostics → Diagnostic buffer → Alert subscription.
For facilities without TIA Portal V18+, the equivalent capability can be implemented programmatically using OB82 for module-level diagnostic events (see Siemens S7-1500 Ob82 Diagnostic Interrupt Programming Guide) or by monitoring the diagnostic buffer indirectly via OPC UA subscriptions from a SCADA system.
For the systematic 8-step framework that uses the diagnostic buffer as Step 2 input in the complete fault diagnosis process, see Plc Diagnostic Troubleshooting Systematic 8-Step Guide Industrial.
Technical Validation
The diagnostic buffer column structure, filter capabilities, and export formats documented in this guide are specified in the Siemens Diagnostic Overview Document 109752283 (V10). The Additional Information panel content specification for S7-1200 user-defined diagnostics is documented in the Siemens User-Defined Diagnostics S7-1200 Document 109483251 (V21). Industrial maintenance diagnostic training outcomes from NIC.edu PLC certification programs.
Frequently Asked Questions
The diagnostic buffer shows no events even though the CPU is in STOP with the ERROR LED lit. Why?
Three scenarios produce this: (1) The buffer was cleared by a CPU memory reset (MRES) prior to the current fault — a complete restart with MRES resets the buffer to empty. (2) The CPU is in DEFECT mode (all LEDs flashing), which prevents TIA Portal from connecting online — the buffer is inaccessible. (3) The fault is a startup-blocking fault that occurs before the diagnostic buffer infrastructure is initialized — in this case, the CPU faceplate display shows the fault code directly (e.g., NO PROJ or HW ERROR) without a corresponding buffer entry.
Can the diagnostic buffer be read from STEP 7 Classic on an S7-1200 CPU?
No. S7-1200 CPUs are not compatible with STEP 7 Classic (SIMATIC Manager). S7-1200 requires TIA Portal V11 or later for programming and diagnostics. However, the integrated web server on S7-1200 V4.1+ provides buffer access via a standard web browser without any Siemens software — connect to the CPU IP address and navigate to the Diagnostics section.
How do I interpret an event that shows “outgoing” but has no corresponding “incoming” event in the buffer?
An Outgoing event without a visible corresponding Incoming event means the Incoming event was overwritten by newer events before the buffer was read. The buffer capacity is finite (50–100 events on S7-1200, 500 on S7-1500); on a system that experienced a long cascade fault before the technician connected, the Incoming event for the root cause may no longer be in the buffer. The Outgoing event still indicates the event class and event number, confirming which type of fault occurred even if the original Incoming timestamp is no longer available.