
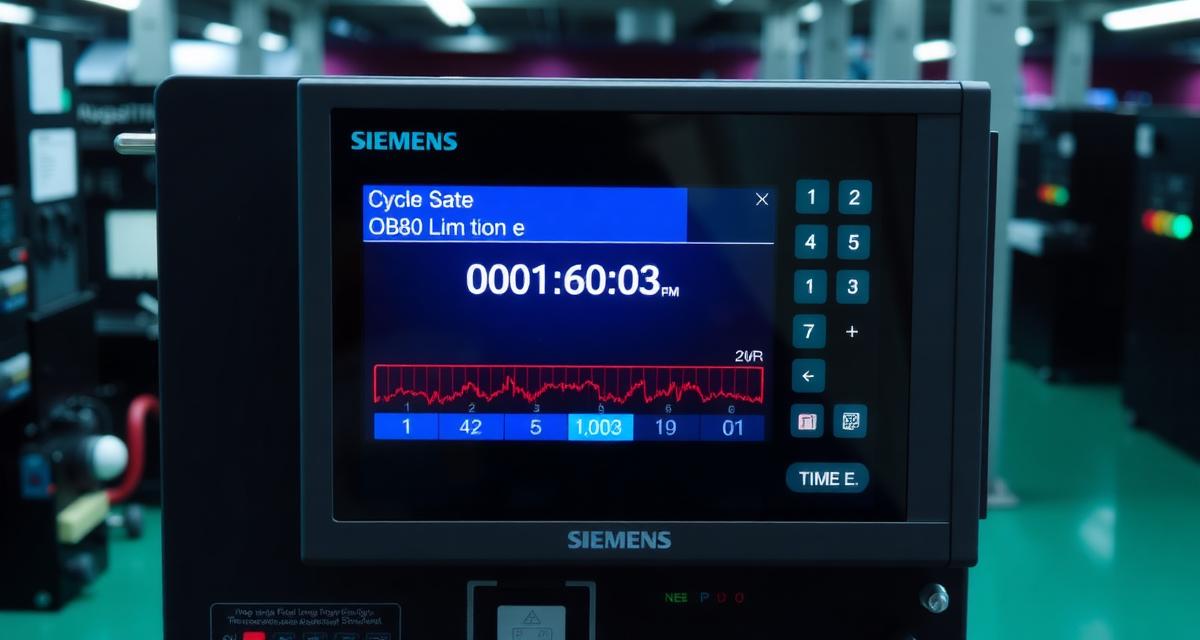
You have just upgraded an S7-300 program to add a new function block for a batch recipe — 15 new network segments in OB1, about 400 new instructions. Nothing unusual. The download completes, you set the CPU to RUN, and within 8 seconds the CPU goes to STOP. The diagnostic buffer shows: OB80, event code B#16#01, OB called: OB80, Error information: time error — cycle time exceeded for the first time. This is the S7-300’s way of reporting that one scan cycle ran longer than the configured maximum cycle time (default: 150 ms), and because OB80 was not programmed, the CPU stopped rather than continuing. The 400 new instructions did not cause a 150 ms scan — the new function block is calling a communication SFC that blocks when the PROFIBUS network is congested. This guide covers the complete cycle time diagnosis from scan time measurement through the specific blocks causing the overrun.
S7-300 OB80 Behavior by CPU Model: Why the Fix Differs
The OB80 B#16#01 diagnosis and fix on an S7-300 depends critically on which CPU model is installed. The table below summarizes the behavioral differences before you begin. Identify your CPU model from the front label, then apply only the relevant diagnosis approach from the sections that follow.
| CPU Model | OB80 Behavior on First Exceedance | Diagnostic Priority | Watchdog Extension Available? |
|---|---|---|---|
| CPU 312 / 312C | STOP immediately — OB80 not called on first occurrence | Reduce scan load or restructure the program | No (fixed 150ms watchdog) |
| CPU 314 / 314C-2DP | OB80 called (if programmed), then STOP on 2nd exceedance | Read T_MAX in STEP 7 Module Info first | Yes (up to 6000ms via SFC29) |
| CPU 315-2DP | OB80 called (if programmed), 2nd exceedance → STOP | Read T_MAX and active interrupt OB load | Yes (up to 6000ms via SFC29) |
| CPU 317-2DP | OB80 called (if programmed), 2nd exceedance → STOP | Read T_MAX and PROFIBUS interrupt load | Yes, but rarely appropriate — fix root cause |
CPU 312 / 312C users: this CPU stops on the first OB80 event with no opportunity to log or respond. If you have a CPU 312, skip directly to the scan time reduction section. OB80 programming is not a valid mitigation for this model.
CPU 314 / 315 / 317 users: you can program OB80 to catch the first occurrence and log it. The second occurrence still stops the CPU. Use OB80 programming to gather diagnostic data during the first occurrence, then address the root cause.
- S7-300 OB80 Behavior: Two Occurrences Before STOP — Comparison by CPU Model (312/314/315/317)
- Step 1: Measure Actual Scan Time Using T_MAX
- Step 2: Identify the Block Causing the Overrun
- Step 3: Temporarily Extend the Watchdog to Diagnose Safely
- Common SFCs That Block Scan Cycles on S7-300
- Step 4: Program OB80 to Prevent STOP on Cycle Time Events
- Step 5: Optimize Scan Load — Techniques for S7-300
- Technical Validation
- Frequently Asked Questions
S7-300 OB80 Behavior: Two Occurrences Before STOP
The S7-300 CPU has a two-stage OB80 response that differs from the S7-1200 and S7-1500:
| Occurrence | S7-300 Response |
|---|---|
| 1st cycle time exceeded (OB80 called 1st time) | OB80 is called. If OB80 is not in the program → CPU goes to STOP immediately |
| 2nd cycle time exceeded within the same program cycle | OB80 called again. If OB80 is programmed but the 2nd exceedance still occurs → CPU goes to STOP regardless |
This is the key S7-300 difference from S7-1200 (V4.4+, where a single occurrence stops immediately without calling OB80 twice). On the S7-300, programming OB80 (even empty) prevents the first-exceedance STOP but not the second. If both exceedances occur in the same scan cycle, the CPU stops regardless.
The event code B#16#01 in the OB80 startup information (#OB80_ERROR_INFO) means: time error — cycle time exceeded for the first time. If the error info is B#16#02, it is the second exceedance (and the CPU is about to STOP regardless of OB80).
OB80 behavior and scan overrun risk by S7-300 CPU model:
| Feature | CPU 312 / 312C | CPU 314 / 314C-2DP | CPU 315-2DP | CPU 317-2DP |
|---|---|---|---|---|
| Default max cycle time | 150 ms | 150 ms | 150 ms | 150 ms |
| Minimum configurable watchdog | 1 ms | 1 ms | 1 ms | 1 ms |
| T_MAX readable via STEP 7 Module Info | Yes | Yes | Yes | Yes |
| DP interfaces (blocking SFC risk) | None | 1× optional | 2× | 2× |
| PROFIBUS SFC blocking risk (SFC58/59) | Low — no DP | Medium | High | High |
| Max program memory | 32 KB | 96 KB | 128 KB | 512 KB |
| Typical interrupt OB load | Low | Medium | Medium–High | High |
Practical implication: CPU 312 has no PROFIBUS DP interface, so blocking SFCs like SFC58 (WR_REC) and SFC59 (RD_REC) do not apply — the scan overrun on a CPU 312 is almost always caused by a loop or large data movement instruction, not by PROFIBUS congestion. CPU 315-2DP and CPU 317-2DP with two active DP interfaces are the highest-risk models for PROFIBUS-triggered OB80 events, especially when high-speed slaves (servo drives, high-speed weighing modules) are connected with short poll cycles.
For comparison with S7-1200 OB80 behavior, see Siemens Ob80 Cycle Time Exceeded S7-1200 S7-1500 Fix.
Step 1: Measure Actual Scan Time Using T_MAX
The S7-300 CPU’s system data block (SDB) contains the actual cycle time values. Access them via STEP 7 to measure the current scan load:
STEP 7 → PLC → Diagnostics/Setting → Module Information →
CPU → Performance Data tab →
Read:
  Minimum cycle time: [ms]
  Maximum cycle time: [ms]  ← This is T_MAX — the longest scan recorded
  Set cycle time: [ms]      ← This is the watchdog setting
If T_MAX is close to or exceeds the “Set cycle time,” the cycle time violation is occurring or is imminent.
Alternative: read via SFC63 GET_SYS_EX in the program: SFC63 in S7-300 reads extended system data including actual scan time values. If the program cannot be accessed for measurement, the Module Information path above is sufficient.
Step 2: Identify the Block Causing the Overrun
The cycle time overrun is caused by one or more specific function blocks or SFCs taking more time than expected. The diagnostic approach is to isolate:
Method 1 — Disable newly added blocks: If the overrun started after adding specific blocks (as in the scenario above), temporarily comment out or skip the new function block calls in OB1. Use a BOOL tag to enable/disable the new calls. If the overrun disappears with the new block disabled, the new block is the cause.
Method 2 — Use system time measurement in the program: The S7-300 supports reading the current CPU clock with SFC1 (READ_CLK). By calling SFC1 before and after a suspect block call, the execution time can be measured and stored in a DB for online monitoring. The time difference (in μs) identifies whether that specific block is consuming disproportionate scan time.
Most common causes of sudden S7-300 scan time increase: – An SFC that communicates over PROFIBUS or MPI (SFC59, SFC60, SFC61) blocking when the network is congested – An INT (interrupt) OB that is being called very frequently and consuming time from the main OB1 cycle – A loop construct (FOR, WHILE in SCL or JMP in STL) that iterates more times than expected due to an incorrect variable value
Step 3: Temporarily Extend the Watchdog to Diagnose Safely
If the cycle time overrun causes repeated STOP conditions that prevent online access, temporarily extending the watchdog setting allows the CPU to run long enough for measurement. The watchdog can be extended in the CPU properties without a full program download:
STEP 7 → HW Config →
Double-click CPU → Properties →
Cycle/Clock Memory tab →
Scan cycle monitoring time: increase from 150 ms to 500 ms or 1000 ms
→ Download CPU data only (not full program) → Accept
After extending the watchdog, set the CPU to RUN and use STEP 7 Module Information to read T_MAX. This identifies whether the overrun is marginal (T_MAX = 155 ms with 150 ms watchdog) or severe (T_MAX = 800 ms with 150 ms watchdog).
Important: restore the watchdog to the original value or an appropriate value after diagnosis. A watchdog set to 1000 ms or higher provides limited protection against true infinite loops.
Common SFCs That Block Scan Cycles on S7-300
Several S7-300 standard SFCs and FBs can cause scan blocking when the communication layer is congested or unavailable:
| SFC/FB | Function | Blocking Condition |
|---|---|---|
| SFC59 (RD_REC) | Read data record from DP slave | Blocks until slave responds or timeout |
| SFC60 (GD_SND) | Send global data | Blocks if MPI communication bus congested |
| SFC61 (GD_RCV) | Receive global data | Blocks if MPI communication bus congested |
| SFC58 (WR_REC) | Write data record to DP slave | Blocks until slave acknowledges or timeout |
| SFB52 (RDREC) | Read data record (newer firmware) | Blocks until complete |
| SFC14 (DPRD_DAT) | Read consistent data from DP slave | Can block in some configurations |
If any of these SFCs are present in the recently modified program and were not present before the overrun started, they are the primary suspect. The fix is to make the calls asynchronous — check the SFC’s BUSY output and only initiate a new transfer when the previous one is complete, rather than calling the SFC every scan.
Diagnosis Approach Compared: CPU 312 vs CPU 314/315/317
The practical diagnosis diverges at Step 1 depending on the CPU model:
For CPU 312/312C: T_MAX is NOT readable via STEP 7 Module Information. The CPU does not expose the T_MAX value. Diagnosis starts from program logic analysis: use STEP 7 Performance Analysis (Extras → Performance Analysis) to measure scan time per function block, then identify which FB or FC is consuming the most scan time.
For CPU 314/315/317: T_MAX IS readable. In STEP 7 Classic → PLC → Module Information → Performance Data → note the T_MAX value. Compare T_MAX against the configured watchdog (OB1 Properties → Cycle Time in HW Config). The ratio T_MAX/Watchdog tells you whether this is a transient spike (T_MAX close to but under watchdog) or a systematic overload (T_MAX >> watchdog).
Step 4: Program OB80 to Prevent STOP on Cycle Time Events
Programming OB80 (even an empty block) prevents the CPU from stopping on the first cycle time exceedance. This gives the program time to handle the condition rather than forcing an immediate STOP:
Minimal OB80 (prevents first-exceedance STOP):
ORGANIZATION_BLOCK OB80
TITLE = Cycle Time Exceeded
BEGIN
    // Empty — presence alone prevents STOP on first exceedance
END_ORGANIZATION_BLOCK
OB80 with diagnostic logging (preferred):
ORGANIZATION_BLOCK OB80
VAR_TEMP
    OB80_EV_CLASS : BYTE;    // Event class information
    OB80_FAULT_ID : BYTE;    // Fault identifier (B#16#01 = first exceedance)
    OB80_PRIORITY : BYTE;    // OB80 priority
    OB80_OB_NUMBR : BYTE;    // OB number (always 80)
    OB80_RESERVED_1 : BYTE;
    OB80_RESERVED_2 : BYTE;
    OB80_ERROR_INFO : WORD;  // Error info (B#16#01 = first, B#16#02 = second)
    OB80_DATE_TIME : DATE_AND_TIME;
END_VAR
BEGIN
    // Store error info to a global DB for trending
    DB_DIAGNOSTICS.CycleExceed_Count := DB_DIAGNOSTICS.CycleExceed_Count + 1;
    DB_DIAGNOSTICS.CycleExceed_LastInfo := OB80_ERROR_INFO;
END_ORGANIZATION_BLOCK
After the second exceedance (OB80_ERROR_INFO = B#16#02), the CPU stops regardless of OB80 content.
Step 5: Optimize Scan Load — Techniques for S7-300
After identifying the cause of the cycle time overrun, apply the appropriate optimization:
For SFC blocking calls: implement an asynchronous calling pattern using the SFC’s BUSY output. Only call the SFC when BUSY = FALSE and it has not been called this scan; wait for BUSY to return to FALSE before the next call.
For excessive interrupt OB calls: if OB35 (Cyclic Interrupt) is set to a very short interval (e.g., 1 ms) and contains substantial code, the interrupt OB load can dominate the CPU. Increase the OB35 interval or move time-critical calculations to a hardware counter (FM or CP module).
For large data processing loops: use the S7-300’s SFC47 (WAIT) technique to voluntarily yield scan time during long loop iterations. SFC47 suspends execution for a specified time, allowing the scan to complete and restart. This extends the wall-clock time for the calculation but prevents the watchdog from triggering.
For how the S7-400’s extended scan time configuration compares to the S7-300 OB80 architecture, see Siemens S7-400 Cpu Fault Codes Step 7 Diagnostic Buffer Complete.
Technical Validation
OB80 behavior and cycle time monitoring reference for S7-300 from the Siemens STEP 7 Error Code Reference Document 770453. S7-300 OB80 cycle time configuration discussion from the Siemens Industry Support Forum OB80 thread. Industrial PLC performance and scan time optimization training from Cincinnati State Workforce Development Center PLC programs.
Frequently Asked Questions
The S7-300 CPU shows cycle time exceeded in the diagnostic buffer but the T_MAX reading in Module Information is only 145 ms with a 150 ms watchdog. How can a 145 ms scan exceed a 150 ms watchdog?
The T_MAX value in Module Information is a rolling measurement — it reflects the maximum scan time observed in the last N cycles (the window size varies by CPU model). If the overrun occurred during a brief congestion event (e.g., a 200 ms scan during a PROFIBUS retransmission event that has since resolved), T_MAX may show the normal operating value at the time of reading. The diagnostic buffer timestamp shows when the OB80 event actually occurred. To capture the actual overrun scan time, check the OB80 startup information variable OB80_DATE_TIME in the logged event, and compare to any concurrent PROFIBUS events in the buffer.
After programming OB80, the S7-300 runs but the diagnostic buffer shows OB80 being called once per second. Is this normal and what does it indicate?
OB80 being called once per second means one scan cycle per second is exceeding the watchdog time — a significant ongoing problem, not a transient event. With OB80 programmed, the CPU avoids STOP on the first exceedance but the underlying cause is still active and recurring. The scan load is marginally above the watchdog threshold on a regular basis. The fix is to reduce the scan load (optimize the blocking SFC calls, increase the calling interval for frequent routines) or to increase the watchdog time to a value that accommodates the actual required scan time plus a 20% safety margin.
The S7-300 went to STOP because OB80 was not programmed. The diagnostic buffer shows only the OB80-missing event. How can I determine the actual scan time at the time of STOP?
When an S7-300 stops because OB80 is missing, the CPU does not log the actual scan time — it logs only the “organization block OB80 missing” event. The actual scan time can only be inferred as “greater than the configured cycle monitoring time.” To measure the exact peak scan time: add an empty OB80 to the project, restart the CPU, then read T_MAX from STEP 7 → PLC → Diagnostics/Setting → Module Information → Performance Data. This reflects the current peak scan. If the problem recurs, T_MAX at the time of recurrence shows the actual overrun value. For future prevention, program OB80 to log the scan time value using SFC20 (BLKMOV) to write OB80_DATE_TIME to a diagnostic data block on each OB80 call.