
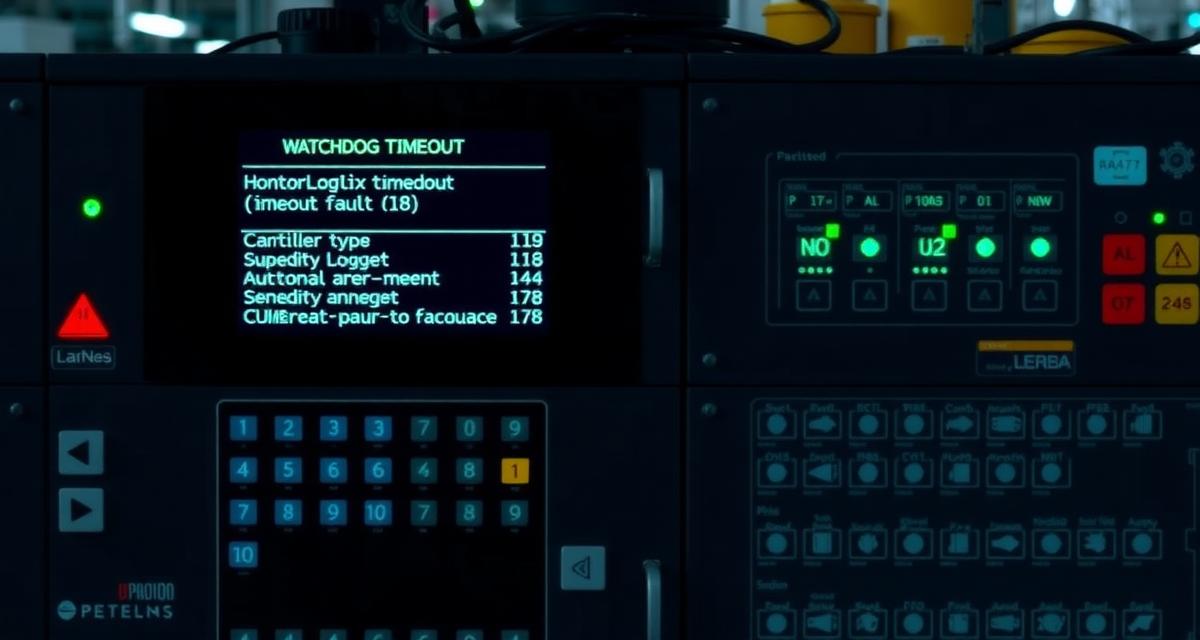
This ControlLogix watchdog timeout fault type 4 code 42 fix for Studio 5000 covers the complete diagnostic and resolution workflow. Measure the scan time of the faulting task before making any program changes — without that baseline measurement, you are guessing at the cause of the watchdog timeout and your fix may not address the actual bottleneck. The GSV instruction gives you the exact execution time of any task in the Logix5000 controller as a LINT value with microsecond resolution, without any additional hardware or software beyond the controller itself. This guide provides the GSV-based scan time measurement procedure, the Cross Reference tool method for locating infinite loops, and the task splitting pattern that resolves the most common root cause — a periodic task that does too much work per period.
- What Type 4 Code 42 Means and the Sub-code Distinction
- Step 1: Measure Scan Time with GSV Before Touching the Program
- Step 2: Locate the Task and Routine from the Fault Record
- Step 3: Find Infinite and Runaway Loops with Cross Reference
- Step 4: Identify Communication Instructions Blocking the Scan
- Step 5: Split Overloaded Periodic Tasks
- Step 6: Safely Increase the Task Period as a Temporary Measure
- Prevention: Proactive Scan Time Monitoring
- Technical Validation
- Frequently Asked Questions
What Type 4 Code 42 Means and the Sub-code Distinction
Type 4, Code 42 in the Logix5000 fault system means a task watchdog timeout: the task did not complete its execution within the configured Period (for periodic tasks) or within the configured Maximum Scan Time (for the continuous task). The controller halts that task and all higher-priority tasks, transitions to FAULTED state, and waits for fault clearance.
The Sub-code is critical for directing the fix:
| Sub-code | Task Type | Period Configuration Path | Typical Root Cause |
|---|---|---|---|
| 0 | Continuous task | Controller Properties → Tasks → [Continuous task] → Period (max scan time) | Infinite loop; excessive MSG instruction blocking; very large array copy |
| 1 | Periodic task | Controller Properties → Tasks → [Periodic task] → Period | Task executes more slowly than its period; task was assigned too much logic |
| 2 | Event task | Controller Properties → Tasks → [Event task] → Period | Event task logic too complex for event-driven execution |
The Task Name in the fault record identifies exactly which task faulted. This immediately tells you which of the three categories applies before any further investigation.
Step 1: Measure Scan Time with GSV Before Touching the Program
The GSV instruction reads the Logix5000 controller’s internal task timing registers. For scan time measurement, the relevant system objects are:
For the continuous task:
GSV(Task, MainTask, LastScanTime, #LastScanTime_DINT)
GSV(Task, MainTask, MaxScanTime, #MaxScanTime_DINT)
For a periodic task named “ProdTask”:
GSV(Task, ProdTask, LastScanTime, #ProdTask_LastScan)
GSV(Task, ProdTask, MaxScanTime, #ProdTask_MaxScan)
The returned values are in microseconds (µs). Divide by 1000 to convert to milliseconds for comparison with the task Period (configured in milliseconds).
Implementation pattern:
1. Add the GSV instructions to a network in the task’s main routine (or in a utility periodic task that monitors all other tasks)
2. Connect online in Studio 5000 → Monitor the #MaxScanTime_DINT tag
3. Run for 10–15 minutes under normal production load
4. The maximum scan time value represents the worst case — compare to the task Period × 1,000,000 (to convert Period from ms to µs)
If #MaxScanTime_DINT is consistently above 80% of the Period value (in µs), the task is marginal and will fault under heavy communication or interrupt load. If it is above 100%, the task is faulting on every period.
GSV Task Attribute Reference:
| Attribute | Type | Unit | Description |
|---|---|---|---|
| LastScanTime | LINT | µs | Execution time of the most recently completed scan |
| MaxScanTime | LINT | µs | Maximum scan time recorded since last controller restart |
| MinScanTime | LINT | µs | Minimum scan time recorded; useful for capacity planning baseline |
| Rate | DINT | ms | Configured period (periodic tasks only) — read-only from Controller Properties |
| Status | DINT | bitmask | Bit 0: task running; Bit 1: task faulted; Bit 2: task inhibited |
Reset MaxScanTime without restarting the controller using the SSV instruction: SSV(Task, [TaskName], MaxScanTime, 0). This clears the accumulated maximum and lets you capture a clean worst-case value from a known production state — eliminating inflated readings from startup transients or non-representative commissioning conditions.
Step 2: Locate the Task and Routine from the Fault Record
From Studio 5000 (while controller is faulted):
Controller Properties → Faults tab
Record: Task Name, Routine Name, Rung Number.
Then navigate: Project tree → Tasks → [Task Name] → [Program Name] → [Routine Name] → Rung [Rung Number]
The identified rung is where execution was at the time of the watchdog timeout — not necessarily the rung that caused the overrun. For a watchdog timeout caused by a loop earlier in the routine, execution reaches the timeout at whatever rung was executing when the watchdog fired, which may be far from the loop that started the problem. Use the Cross Reference tool in the next step to scan the entire routine for loops.
Step 3: Find Infinite and Runaway Loops with Cross Reference
Infinite and runaway loops in Logix5000 programs are most commonly implemented with one of three constructs: – JSR/RET loop: a subroutine that calls itself (recursive JSR) or calls another subroutine that eventually calls the first one (mutual recursion) – JMP backward: a JMP instruction that jumps to a LBL earlier in the same routine, creating a loop – FOR loop (Structured Text / FBD): a FOR or WHILE loop with a faulty exit condition
Cross Reference for JMP instructions:
Studio 5000 → Tools → Cross Reference →
Filter: Type = JMP →
Check: "Show Jump-to-Label connections"
Any JMP instruction whose target LBL is physically earlier in the routine (lower rung number) creates a backward branch — a potential infinite loop. Verify that every such backward JMP has a condition that eventually evaluates to FALSE to exit the loop.
Cross Reference for JSR recursive calls:
Tools → Cross Reference → Filter: Instructions = JSR
If a routine’s name appears as the target of a JSR within itself, or if a JSR chain can be traced back to the calling routine, a recursive call exists. Logix5000 does not natively prevent recursive JSR calls — the controller will continue recursing until the stack overflows (generating Type 4 Code 4 — stack overflow) or the watchdog fires.
Step 4: Identify Communication Instructions Blocking the Scan
MSG (Message) instructions in the Logix5000 are asynchronous — they initiate a communication request and complete in a later scan. However, improperly sequenced MSG instructions can create a blocking condition:
The blocking MSG pattern (problematic):
Network 1: [MSG.EN] --[/]-- [MSG] (Enabled only when not already enabled)
Network 2: [MSG.DN] --[|]-- [MSG.ER] --[|]-- [Reset sequence bit]
If the MSG timeout is long (default: 90 seconds on EtherNet/IP) and the network is congested, the scan waits for the MSG to complete before the next MSG can be initiated. Multiple stacked MSG instructions with sequential dependencies can accumulate to exceed the watchdog period.
Fix: use the MSG.IP (In Progress) bit rather than MSG.EN bit for enabling logic. Set MSG timeout to values appropriate for your network (typically 5–10 seconds for a local EtherNet/IP network). For non-critical data, use a lower-priority periodic task for MSG instructions so that communication timeouts do not affect the production-critical continuous task.
For EtherNet/IP connection configuration including RPI settings that affect MSG timing, see Allen-Bradley Ethernet/Ip Connection Timeout Fault Controllogix Fix.
Step 5: Split Overloaded Periodic Tasks
When a periodic task contains too much logic for its period — confirmed by GSV measurement showing MaxScanTime exceeding the Period — the solution is to split the task into two or more periodic tasks with different period settings:
Before split (one task doing everything):
PeriodicTask_10ms:
  - Production control logic (needs fast scan)
  - Quality data logging (can be slower)
  - HMI tag updates (can be slowest)
  - Energy monitoring calculations (can be slowest)
  Total execution time: 14 ms on a 10 ms period → FAULT
After split:
PeriodicTask_10ms: (Priority: highest)
  - Production control logic only
  Execution time: 4 ms on a 10 ms period → 40% utilization

PeriodicTask_100ms: (Priority: lower)
  - Quality data logging
  - HMI tag updates
  Execution time: 12 ms on a 100 ms period → 12% utilization

PeriodicTask_1000ms: (Priority: lowest)
  - Energy monitoring calculations
  Execution time: 8 ms on a 1000 ms period → 0.8% utilization
Task split procedure in Studio 5000: 1. Controller Properties → Tasks → Add New Task → Periodic → Set Period and Priority 2. In the new task, create a new Program with the routines to be moved 3. Cut the relevant routines from the original program and paste into the new program 4. Update all cross-references: tags shared between programs must be Controller-scope tags (not Program-scope) 5. Verify Controller (Ctrl+Shift+K) → resolve scope errors 6. Download and test with GSV monitoring active
Step 6: Safely Increase the Task Period as a Temporary Measure
Increasing the task Period is a valid emergency measure to restore production while the root cause fix is implemented:
Controller Properties → Tasks → [Faulting Task] → Period →
Increase by 50% of original value
Safety constraints: – For a continuous task: increasing the “Maximum Scan Time” increases the watchdog window but also increases the delay before a runaway loop is detected. Do not exceed 2× the original maximum scan time during production. – For a periodic task: increasing the Period reduces how often the task runs. Ensure that the control logic in the task is still functionally correct at the increased period (e.g., a 10 ms PID loop running at 50 ms may have different stability characteristics).
Document the period change and set a deadline to implement the root cause fix. For the complete Allen-Bradley fault type and code reference, see Allen-Bradley Controllogix Fault Codes Complete List Studio 5000. For the systematic 8-step diagnostic framework, see Plc Diagnostic Troubleshooting Systematic 8-Step Guide Industrial.
Prevention: Proactive Scan Time Monitoring
Implement proactive scan time monitoring before a fault occurs:
Monitoring ladder (in a low-priority periodic task):
[GSV(Task, CriticalTask, MaxScanTime, #MaxScan_us)]
[DIV(#MaxScan_us, 1000, #MaxScan_ms)]
[GRT(#MaxScan_ms, #WatchdogPeriod_ms)] → [SET(#ScanTimeAlarm)]
Where #WatchdogPeriod_ms is set to 80% of the task’s configured period. When the alarm bit goes high, the HMI or SCADA can alert maintenance to investigate scan time before the watchdog threshold is reached.
Technical Validation
Type 4 Code 42 Sub-code specification from Rockwell Publication 1756-PM014. GSV task timing measurement methodology from NFM Consulting Allen-Bradley faultfinding diagnostics. Task splitting best practices validated by industrial PLC training programs at Moraine Park Technical College PLC boot camps.
Frequently Asked Questions
Type 4 Code 42 appears only during production peak hours. How do I capture scan time at the moment of the fault?
The GSV MaxScanTime attribute captures the all-time maximum scan time since the last CPU restart. If the fault occurs at peak hours and the CPU was restarted after each fault, the MaxScanTime value is reset and the peak measurement is lost. Implement a ladder-based scan time logger (as shown in the Prevention section) that writes MaxScanTime to a retain DINT tag on every scan. The retain tag preserves the value through the CPU fault and restart, giving you the pre-fault maximum scan time on the next connection.
For a time-stamped record, pair the MaxScanTime log with a wall-clock read: GSV(WallClockTime,,LocalDateTime,#DateTime_LINT). Write the DINT pair — scan time plus timestamp — into a FIFO DINT array on every new maximum. This creates a chronological history of when scan time began rising, which you can correlate directly with production event logs to identify the operational trigger: a recipe change, a new batch type, the addition of a communication peer, or a specific operator action. The timestamp correlation typically narrows the root cause to a single process event in fewer than five minutes, compared to hours of hypothesis testing without timeline data.
Can I set a different watchdog timeout for specific routines within a periodic task?
No. The Logix5000 watchdog is applied at the task level, not the routine level. The entire task must complete within the configured Period. There is no per-routine timeout. However, you can simulate per-routine time budgeting by using the GSV LastScanTime attribute to measure total task execution time at the end of each routine, and branching to a JMP skip block if the accumulated time exceeds a configurable threshold — effectively performing voluntary early-exit from lower-priority routines to protect the watchdog.
After splitting the periodic task, the controller shows a new Type 4 Code 42 on the new task. What went wrong?
The new task inherited more execution time than expected because: (1) the routines moved to the new task contain program-scope tags that were not converted to controller-scope — each tag resolution adds overhead, (2) the new task’s period was set too short for the routines it contains, or (3) MSG instructions moved to the new task have timeout values that fit within the old task’s period but not the new task’s period. Re-run GSV MaxScanTime measurement on the new task immediately after splitting to establish its actual execution time before adjusting the period.